11. March 2024 By Daniil Zaonegin
Diagnosis of thread pool defects
.NET applications use threads to execute their work instructions. Examples of this are the processing of a request in a web application or the parallelisation of work instructions, whereby several threads can run in parallel and the results are merged at the end. A thread pool provides a predefined number of such threads, which are usually already created. Using a thread pool makes it possible to simply use predefined threads from the pool without having to create them again and again.
A thread pool bottleneck (also known as "thread pool exhaustion") occurs when a thread is requested from the thread pool, but the pool can no longer provide one. In the case of time-intensive operations or high loads on a web server, users may then have to wait a very long time for a response. Even if the size of the thread pool under .NET is variable within certain limits, users have to wait as soon as the maximum number of available threads is reached. Changing the thread pool size also takes time.
The problem
The application is an ASP.NET Core WebAPI under .NET 8, which is used as the basis for a single-page application (SPA). Previously, we hosted it on an IIS under Windows, where it ran very quickly. After migrating to Linux in a Docker container, the response times almost doubled. This is atypical, so we want to get to the bottom of the problem.
Investigating the problem
.NET comes with a number of tools for diagnosing such problems, but in our case these need to be installed in the Docker container. In particular, we need the dotnet-counters tool, which is part of the Dotnet Cli Diagnostic Tools. These can be installed in the Docker image using a trick. They are first installed in the Publish Stage, which is based on the .NET SDK image. Then you copy the tools in the final stage into the final image. This diversions is necessary as there is no .NET SDK in the final image and therefore the tools cannot be installed. The following code shows a corresponding Dockerfile.
		FROM mcr.microsoft.com/dotnet/aspnet:8.0 AS base
		WORKDIR /app
		EXPOSE 80
		EXPOSE 443
		FROM mcr.microsoft.com/dotnet/sdk:8.0 AS build
		WORKDIR /src
		COPY ["Api/Api.csproj", "Api/"]
		RUN dotnet restore "Api/Api.csproj"
		COPY . .
		WORKDIR "/src/Api"
		RUN dotnet build "Api.csproj" -c Release -o /app/build -p:Linux=true --no-restore
		FROM build AS publish
		RUN dotnet publish "Api.csproj" -c Release -o /app/publish /p:UseAppHost=false -p:Linux=true --no-restore
		#installing tools
		RUN dotnet tool install --tool-path /tools dotnet-trace --configfile Nu-Get.config \
		 && dotnet tool install --tool-path /tools dotnet-counters --configfile Nu-Get.config \
		 && dotnet tool install --tool-path /tools dotnet-dump --configfile Nu-Get.config \
		 && dotnet tool install --tool-path /tools dotnet-gcdump --configfile Nu-Get.config
		FROM base AS final
		# Copy dotnet-tools to base image
		WORKDIR /tools
		COPY --from=publish /tools .
		WORKDIR /app
		COPY --from=publish /app/publish .
		ENTRYPOINT ["dotnet", "Api.dll"]
You can then start the .NET Diagnostic Tools in the app container.
It is also important to deactivate the "Fast Mode" of Visual Studio, because in Fast Mode Visual Studio calls docker build with an argument that instructs Docker to create only the first stage in the Docker file (usually the base stage), the DLLs of the application are created on the local PC and then integrated into the image as a mount (more on this here). To deactivate "Fast Mode", the ContainerDevelopmentMode parameter in the project file (.csproj) must be set to the value "Regular".
		<PropertyGroup>
		   <ContainerDevelopmentMode>Regular</ContainerDevelopmentMode>
		</PropertyGroup>
After starting the app, we search for our container with the command line command docker container ls and then start a command line (bash) with docker exec -it <container id> bash. You can then use the Dotnet Diagnostic Tools in this command line. In our case, we start dotnet-counters with the command /tools/dotnet-counters.
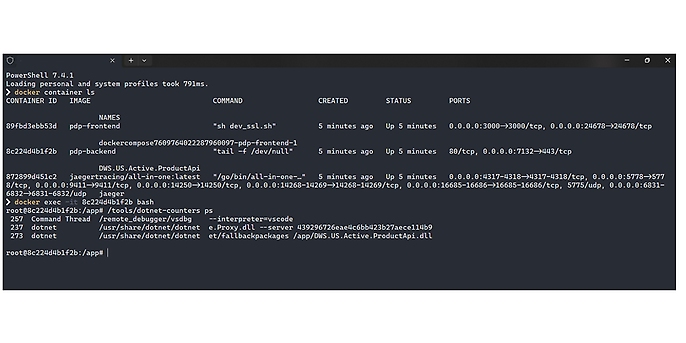
With dotnet-counters ps you can view all existing .NET processes. The command dotnet-counters monitor -process-id=<id> can be used to monitor all performance indicator values that are published via the EventCounter or Meter API. For example, you can use it to display all dotnet metrics. Important metrics for analysing the thread pool are ThreadPool Queue Length and ThreadPool Thread Count.
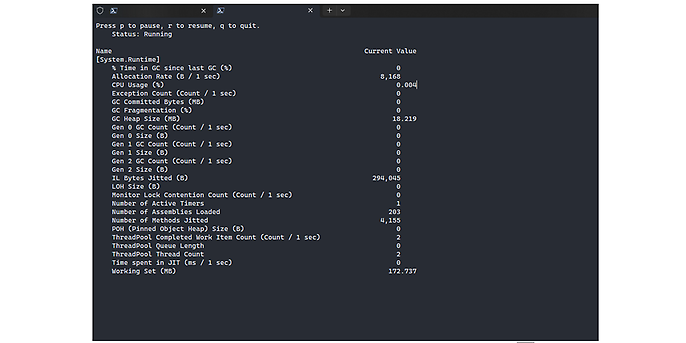
To reproduce the problem, we need to put the system under load and observe the behaviour. This is where another useful tool comes into play: Bombardier. Bombardier is an https benchmarking tool and can send a large number of requests to a server to see how the application reacts.
For the load, I chose the endpoint that was slowest when loading the SPA page. We start our application and generate the load with Bombardier. At the same time, we collect the dotnet metrics in the container with dotnet-counters collect -process-id=<id>. The command attribute collect means "collect metrics in a file".
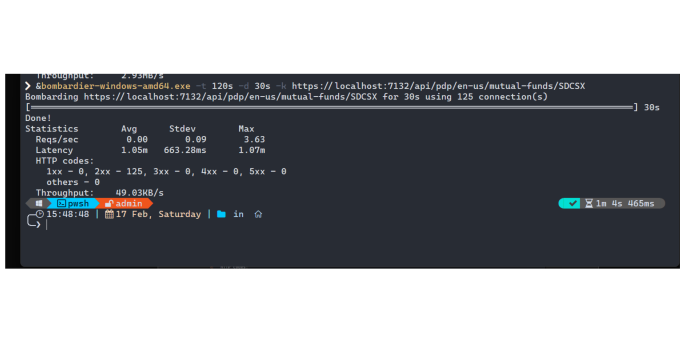
The endpoint has a maximum wait time of 1.17 minutes with a utilisation of 125 connections over 30 seconds, which is of course far too long for an API. But now we know the bottleneck of our application. Let's take a look at the metrics of the thread pool, more precisely the number of threads. Here you can see a graphical representation of the thread pool during utilisation:
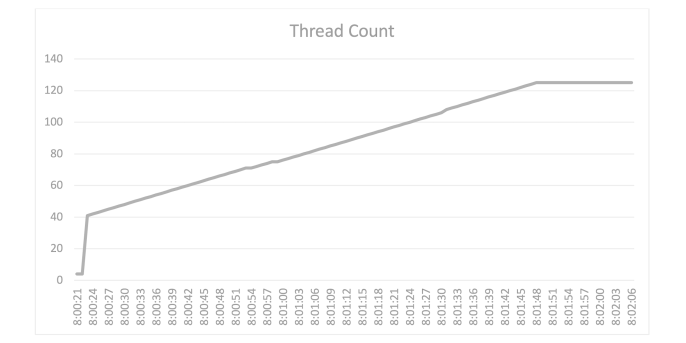
Here you can see that the number of threads triples and then stabilises at 125. As already mentioned, the system increases the number of available threads if there are no more free threads available. However, the runtime needs valuable time for this. The slow increase in thread pool threads with a CPU utilisation of well below 100 percent indicates that a bottleneck in the thread pool is the cause of the performance bottleneck.
To better understand the problem, you can also collect traces of the application. This is done with the diagnostic tool dotnet-trace. The complete command is:
/tools/dotnet-trace collect -p <process-id> --format speedscope.
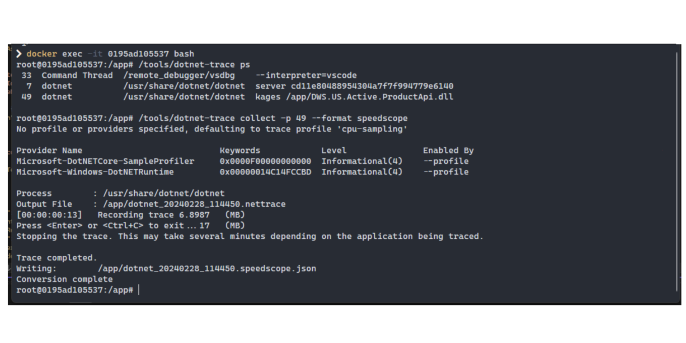
I have collected the trace data here for just one request to understand what the threads are busy with during the user request. The data can be downloaded from https://www.speedscope.app and viewed in the form of a Flame Graph. Flame graphs visualise where in the code most of the time is spent, using nothing more than their stack traces. All similar function calls are grouped by stack depth. In this way, you can find out how long a particular function was executed during profiling.
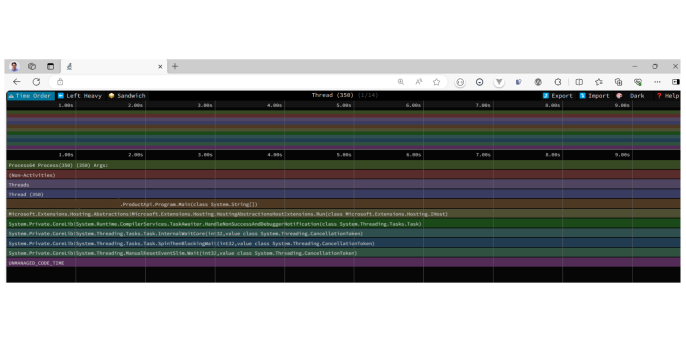
Firstly, we see the Main() method of the application.
The flamegraph shows the threads and methods that are executed and the time required for this. ASP.NET Core uses a lot of threads and we now need to find the thread in which the code of our application is executed. In this case, I found it here:
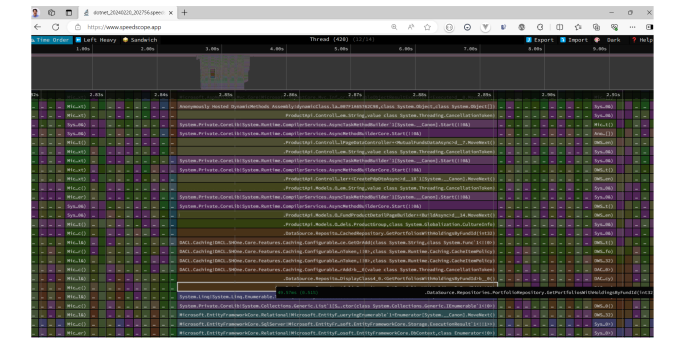
We can see that a database repository method is being executed here. Compared to other methods, this method takes a lot of time.
Further down we see that the method accesses the Entity Framework and even further down how the Entity Framework receives the data from the database. The system waits for the database to deliver the data and blocks the thread until this is the case. This is probably the cause of the problem.
Fixing the problem
To solve the problem, we analyse the controller actions and try to understand what is blocking the threads in the application. The analysis shows that there are several calls to the database repository that are not executed asynchronously.
The difference between a synchronous and an asynchronous call is relatively easy to understand. With a synchronous call, the request is processed in a thread and blocks this thread until the call has been fully processed. If many queries are made to the database that take a long time, the threads need a correspondingly long time to return the results.
An asynchronous call behaves slightly differently. The moment an operation takes a long time, the thread is "released" and can already start processing the next request. The request to the database then runs in the background and as soon as it is completed, the result is retrieved and returned to the caller. In this way, a few threads can process a large number of requests in a reasonable amount of time.
In this particular case, the code looked something like this (not real application code, just for demonstration):
		//Code of controller action
		[HttpGet]
		[Route("{culture:required}/mutual-funds/{identifier:required}")]
		public async Task<ActionResult<PageDataDto?>> GetDataAsync(string culture, string identifier, CancellationToken cancellationToken)
		{
		    PageDataDto? result =
		        await _service.CreatePageDataDto();
		    return Ok(result);
		}
		//===========================================================================
		//Service method code
		public async Task<PageDataDto?> CreatePageDataDto(…)
		{
		    //Code omitted
		    //…
		    var data1 = _repostory.Method1(…);
		    var data2 = _repostory.Method2(…);
		    //Code omitted
		    //…
		    var data10 = _repostory.Method10(…);
		    //Code omitted
		    //…
		    return result;
		}
Nach der Recherche habe ich den Code umgeschrieben und alle Repository-Methoden auf asynchronen Code umgestellt. Dadurch werden die Threads nicht mehr blockiert und stehen für weitere Anfragen zur Verfügung:
		//Service method code
		public async Task<PageDataDto?> CreatePageDataDtoAsync(CancellationToken cancellationToken)
		{
		    //Code ausgeführt auf Thread 1
		    //…
		    var data2 = await _repostory.Method1Async(..., cancellationToken);
		    //Thread 1 wurde freigelassen
		    //Code kann auf dem anderen Thread ausgeführt sein
		    //…
		    return result;
		}
Nach diesen Änderungen ist die Performance um ein Vielfaches besser geworden:
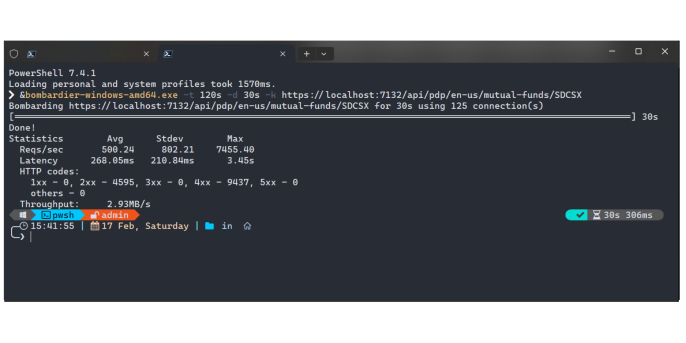
And here is the thread count after optimisation:
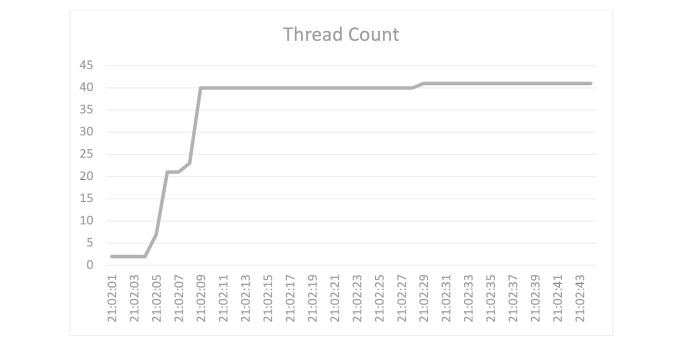
These results show that the problem has been successfully solved.
Would you like to find out more about exciting topics from the world of adesso? Then take a look at our previous blog posts.

