9. November 2021 By Corinna John
Green Cloud Computing
Moving services to the cloud is known to make IT life easier because mobile working reduces the need for travel. But data centres also need energy. Servers and storage systems have to be produced and disposed of again after a few years of use. Isn’t remote operation ultimately much more resource-intensive than traditional on-site work? To do the maths for this, the German Environment Agency has developed what is known as the Green Cloud Computing (GCC) methodology.
What is behind the Green Cloud Computing methodology?
The GCC methodology calculates expenditure indicators for cloud services. The environmental expenditure for producing information technology and operating data centres is recorded in four impact categories:
- Raw material expenditure (Abiotic Depletion Potential, ADP): Use of minerals and fossil raw materials in kilograms of antimony equivalents per year [kg Sb.eq./a]
- Greenhouse gas emissions (Global Warming Potential, GWP): Effect on global warming in kilograms of carbon dioxide equivalents per year [kg CO2.eq./a]
- Cumulative energy expenditure (Cumulative Energy Demand, CED): Consumption of energy resources in megajoules per year [MJ/a]
- Water consumption (Water Usage): Directly consumed water in cubic metres per year [m³/a]
The environmental expenditure is compared with the respective benefit. Units of benefit include, for example, workstations per year for a VDI environment, hours per year for a video conferencing system or terabytes per year for a storage solution. Several services typically run in a data centre. The key figures are broken down to specific cloud services – such as videoconferencing or virtual desktops – by giving each service a percentage share of the environmental impact.
The expenditure indicators indicate how efficiently and thus environmentally friendly the service is provided. ‘GCC = expenditure/benefit’ always applies here. The German Environment Agency calculates four key figures per cloud service:
- GCC ADP: Raw material consumption in kilograms per service unit
- GCC GWP: CO2 footprint in kilograms of CO2 per service unit
- GCC CED: Energy consumption in megajoules per service unit
- GCC Water: Water consumption in cubic metres per service unit
So far, the newly developed expenditure indicators have only been calculated for a few example cases. This means that they cannot be generalised at this stage. Nevertheless, they are already suitable for comparing similar cloud services with each other. To make the figures more tangible, they can be compared with other CO2 footprints such as ‘one kilometre per car journey’.
Video conference example calculation
How many kilometres of travel need to be saved to make a video conference ‘greener’ than a meeting? To achieve an accurate statement, the GCC key figures would have to be determined for the specific service provider. The Environment Agency determined the GCC GWP (CO2 footprint) key figure of a Jitsi provider as an example and came to a surprising conclusion.
The emissions in the data centre and at the participants’ home offices need to be considered separately. The load on the servers was determined from the log files of the Jitsi Videobridge in the data centre. Unfortunately, estimates had to be made from then on, as the Jitsi operator rents its servers from a hosting provider that did not disclose any data on energy consumption.
The benefits of the service should be measured in participant hours. For this purpose, the product is calculated from the number of participants and the length of time each participant spends in a video conference. The period under consideration in this case was one week, so the unit of participant hours was participants*h/week.

The trajectories of (measured) CPU utilisation and (generously estimated) power consumption of all servers followed the number of conference participants almost synchronously. In this respect, there is a correlation between the number of users and energy consumption. From all the power consumed by the server, storage system, network and infrastructure, the integration over time results in a weekly energy expenditure for the cloud service. The weekly expenditure and benefit can now be divided.
That completes our look at the utilisation phase. The expenditure for producing the data centre, which is required to calculate a GCC key figure from expenditure and benefit, is still missing. Here, the available literature was relied on instead. In the end, the greenhouse gas emissions for participating in one hour of videoconferencing were 2.27 grams of CO2 equivalents. This figure is made up of 0.34 grams (15 per cent) for the production of the servers and 1.93 grams (85 per cent) for the utilisation phase in the data centre.
Is that everything? No – the CO2 footprints of the transmission network and home networking of the end devices are still missing.
The amount of data transmitted per participant for one hour of videoconferencing was measured at an average of 612 megabytes per hour and participant. A power consumption of 1.92 watts was obtained from an energy model for telecommunication networks for a VDSL Internet connection (technology level of 2017). Together with the emission factor of the German electricity mix for the year 2018 amounting to 0.468 kilograms of CO2 equivalents per kilowatt hour, the Environment Agency calculated the CO2 footprint of the transmission network for the participant hour in the network to be 0.55 g CO2 eq./h.
When it comes to the devices in the home office, things get complicated, as the devices are used intensively and for different lengths of time. In order to obtain hourly values for the production expenditure, the one-off production expenditure of the respective devices must be divided by the effective useful life into hours per device.
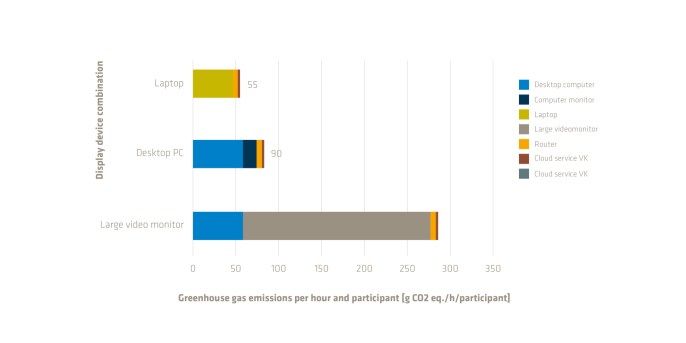
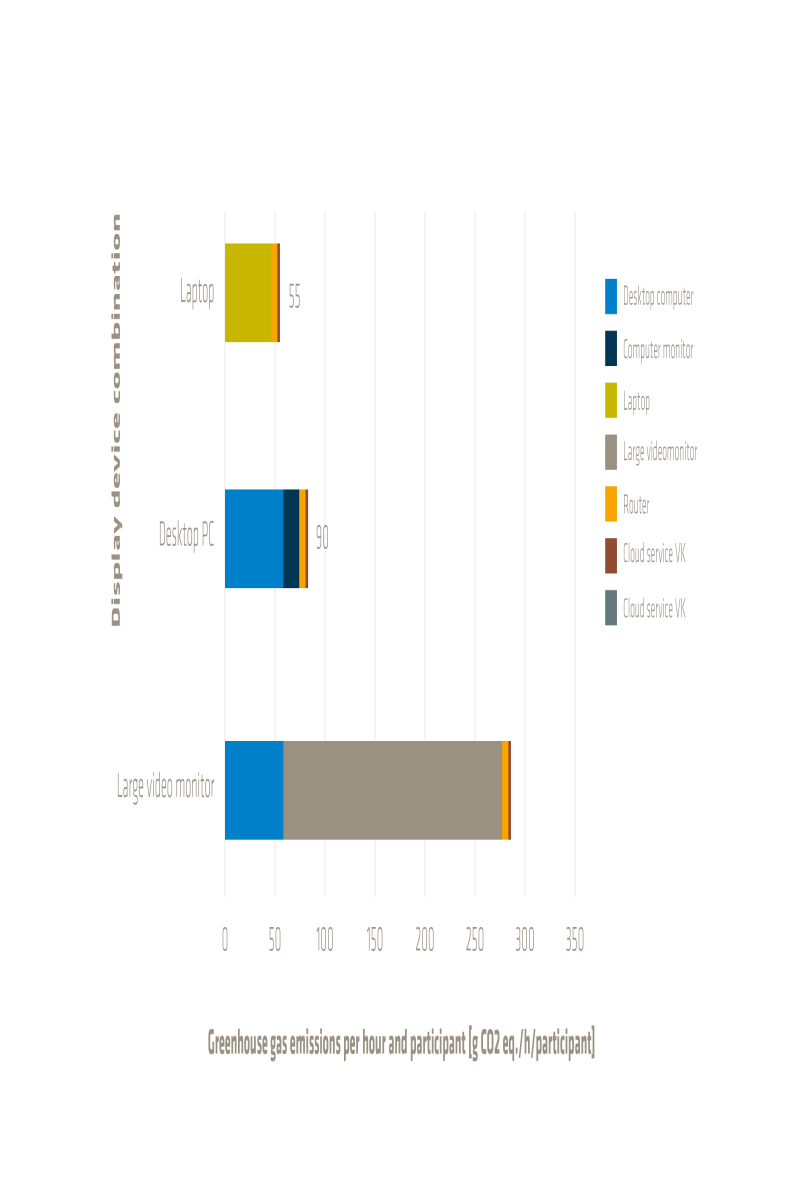
In the example calculation, three fictitious office setups were compared: a laptop on a kitchen table, a home office with a desktop PC and a business office with a large video monitor. The first figure shows the CO2 footprints of the video conference in the three scenarios. Participating with a laptop is associated with 55 grams of CO2 equivalents per hour. With a desktop PC and monitor, it is as much as 90 grams.
What’s that? The key figure for the data centre was only 2.27 grams per hour and participant. That’s right! The greenhouse gas emissions for a conventional office with a screen are almost 40 times higher than the proportional emissions in the data centre. Network and cloud service providers only play a minor role. The energy-saving equipment we have in our office determines how environmentally friendly we work.
When is it worth travelling?
When should we drive to a meeting and when should we attend from home? This is the unanswered question. Can the time we spend travelling be used sensibly? What does the ticket cost? How does the talk time compare to the travel time? Does the journey home clash with leisure activities?

The German Environment Agency uses average figures to calculate the greenhouse gas emissions arising from passenger transport. The following CO2 equivalents per passenger kilometre (Pkm) may be assumed (based on average occupancy of the vehicles):
- Car: 143 g CO2 eq./Pkm
- Public bus: 80 g CO2 eq./Pkm
- Local rail transport: 55 g CO2 eq./Pkm
- Long-distance train: 29 g CO2 eq./Pkm
If you compare the greenhouse gas emissions of videoconferencing with those of the means of transport, you get the distance that could theoretically be travelled to meet at a particular place instead. If the emissions for travelling to and from the office are lower, meeting in person is more climate-friendly. Otherwise, you can stay at home with a clear conscience.
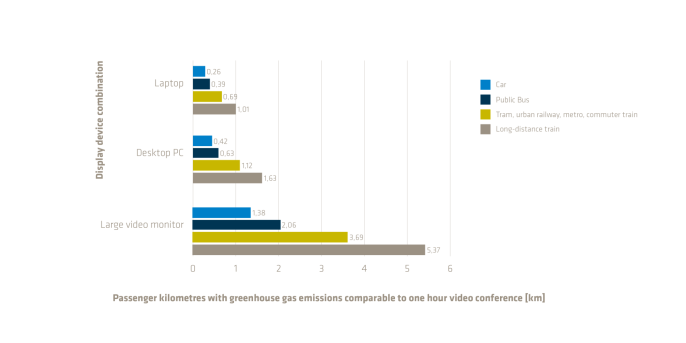
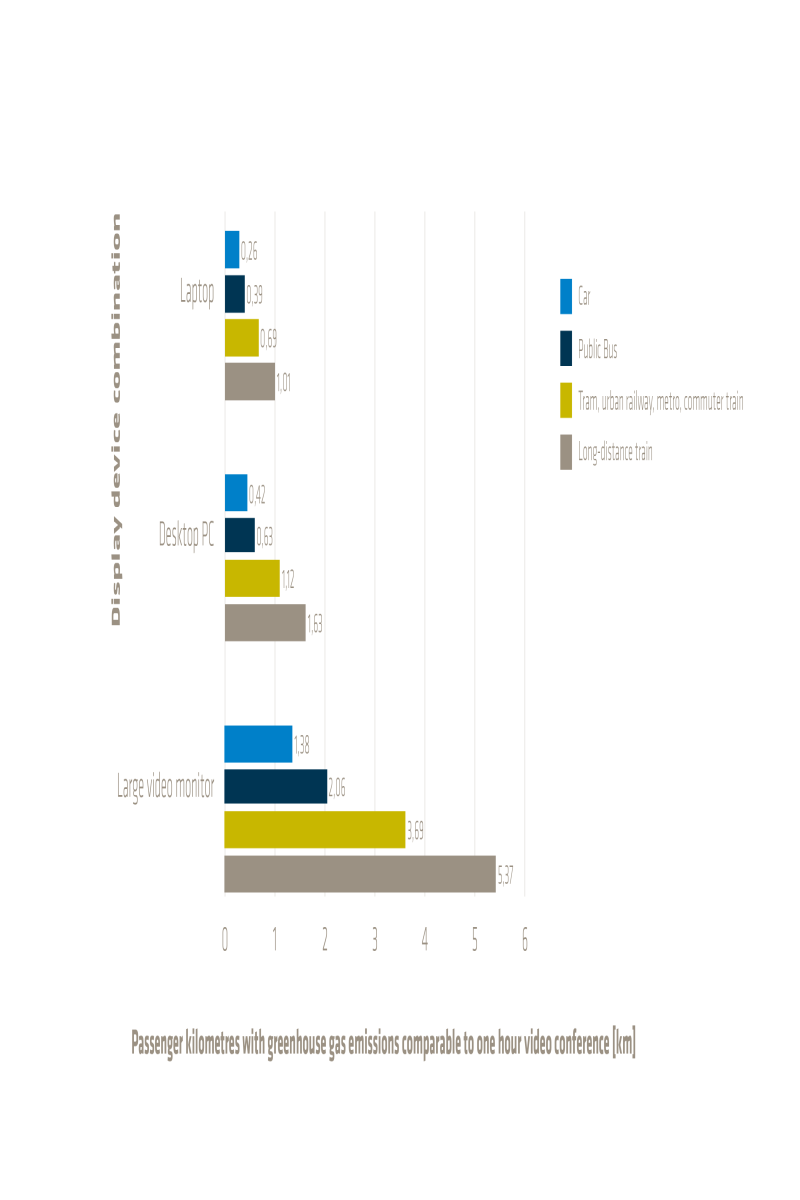
The second figure shows the CO2 emissions of the three fictitious office setups converted into passenger kilometres with different means of transport. If a laptop is used, between 0.26 passenger kilometres can be travelled by car and one passenger kilometre by train per hour of videoconferencing as an alternative.
If travelling by metro, the meeting place must be more than 0.69 kilometres away for the video conference to be more environmentally friendly if participating by laptop as an alternative. When participating with a desktop PC, the meeting place must be more than 1.12 kilometres away. The same applies to the other means of transport, with the long-distance train option being ruled out due to the short distances involved.
To sum up: Walk to your meeting! If it is too far away to walk, then videoconferencing is more climate-friendly.
Use of key figures
The example calculation comes from an example application of the newly developed GCC methodology. It aims to demonstrate that the methodology is well suited to identifying environmental impacts for individual cloud services.
This GCC methodology may be used in the future for an environmental product declaration or energy labelling for cloud services. The obvious thing to do is to award particularly efficient services with an ecolabel such as the German ‘Blue Angel’. Furthermore, it can be used as a tool for optimising the individual sections of a data centre.
By the way, all sources and background information can be found in the publication ‘Green Cloud Computing – Lifecycle-based data collection on the environmental impacts of cloud computing’ from the German Environment Agency (available in German).
Would you like to learn more about exciting topics from the world of adesso? Then check out our latest blog posts.


